Create your own visualization
In SLS gateway you can create your own visualizations. To do this, through the menu Actions-> Script, you need to create the ui.html file. It will be available when accessing / ui. To control devices, you can use the built-in http_api.
The following example displays the temperature value from the sensor.
<script src="https://kit.fontawesome.com/a076d05399.js"></script>

<div id="lbl_temp"></div>

<script>
  fetch('/api/zigbee?action=getStateValue&dev=0x000D6F00106A67FD&name=temperature')
 .then((response) => {
   return response.json();
  })
  .then((data) => {
    document.getElementById("lbl_temp").innerHTML = '<i class="fa fa-thermometer-full" aria-hidden="true"></i> ' + data;
  });
</script>
<script src="https://kit.fontawesome.com/a076d05399.js"></script>
<div id="lbl_temp"></div>
<script>
fetch('/api/zigbee?action=getStateValue&dev=0x000D6F00106A67FD&name=temperature')
.then((response) => {
return response.json();
})
.then((data) => {
document.getElementById("lbl_temp").innerHTML = '<i class="fa fa-thermometer-full" aria-hidden="true"></i> ' + data;
});
</script>Example dashboard using Bootstrap4:
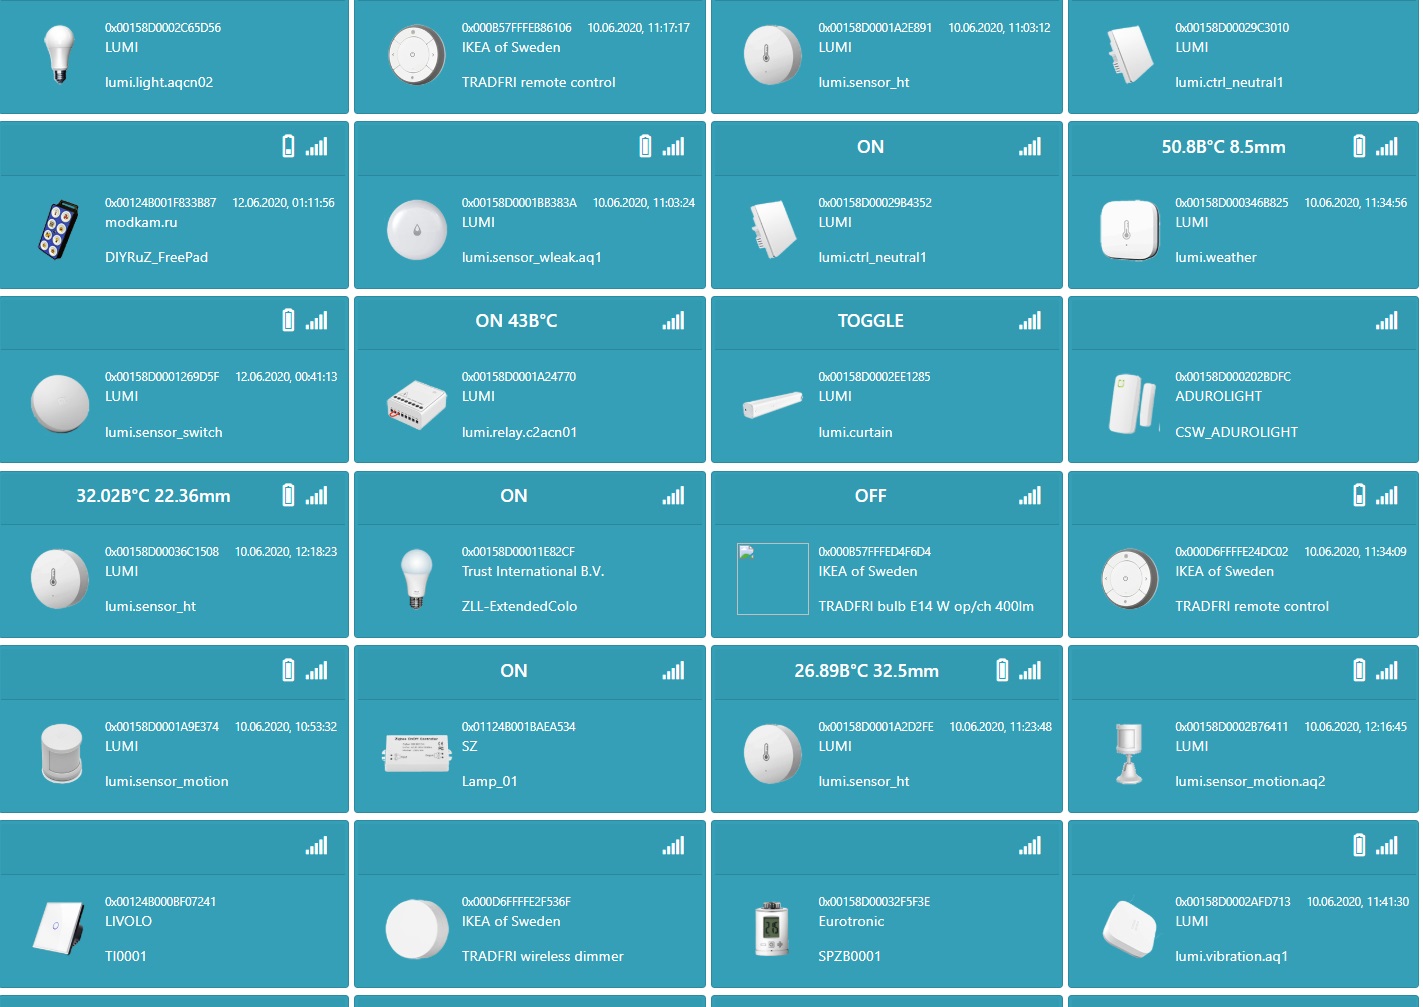
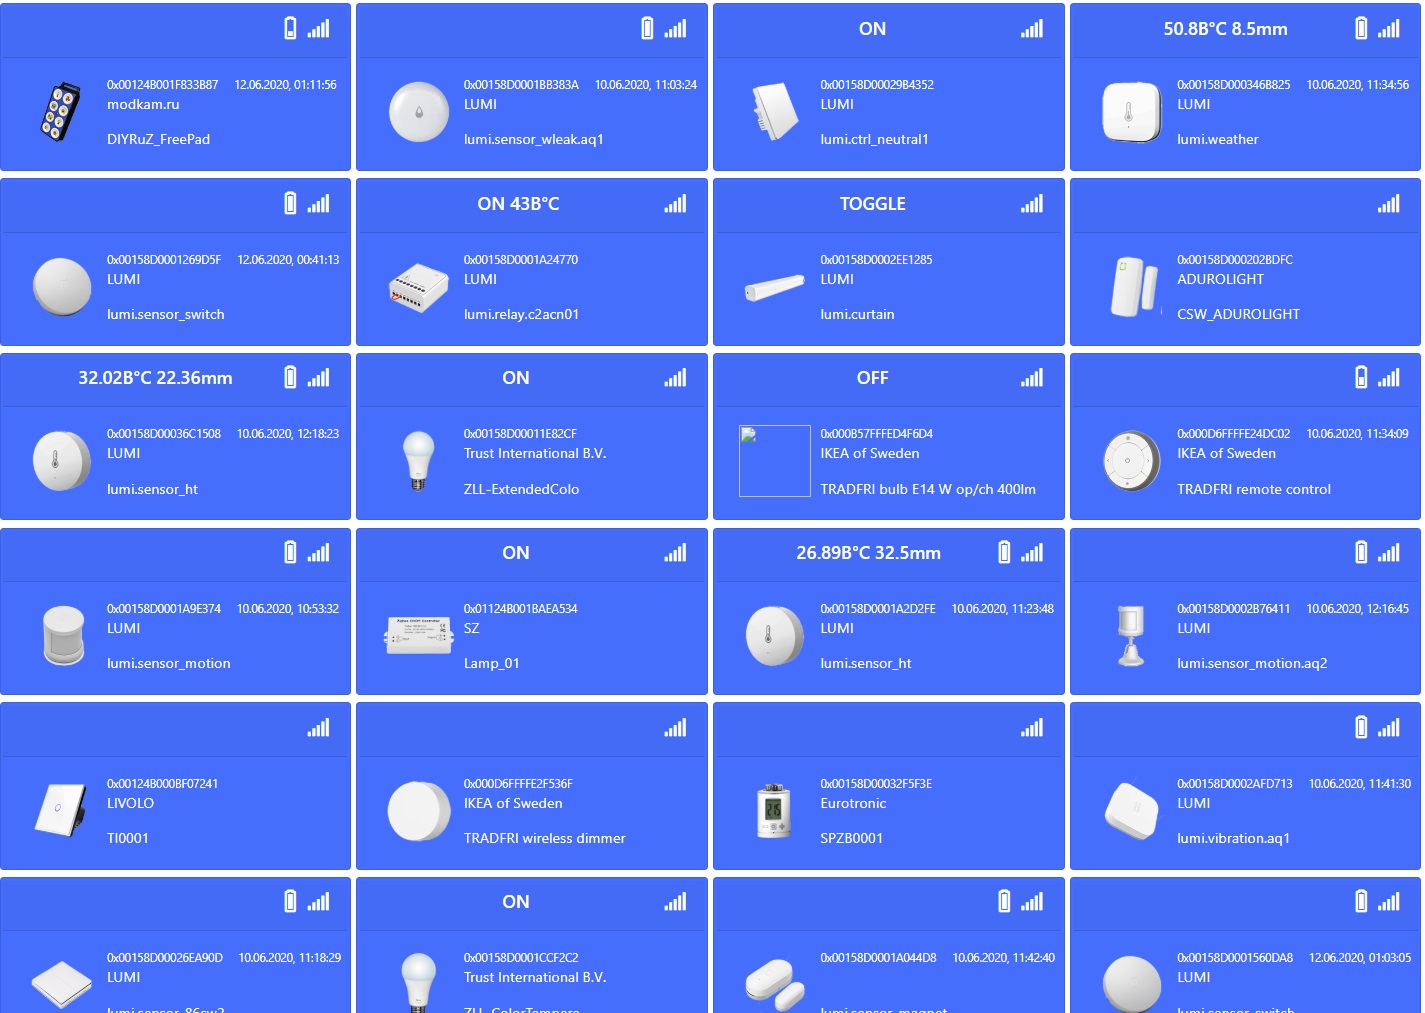
Example dashboard using Bootstrap4:
 [download] https://raw.githubusercontent.com/slsys/Gateway/master/dashboard/bootstrap41/ui.html)
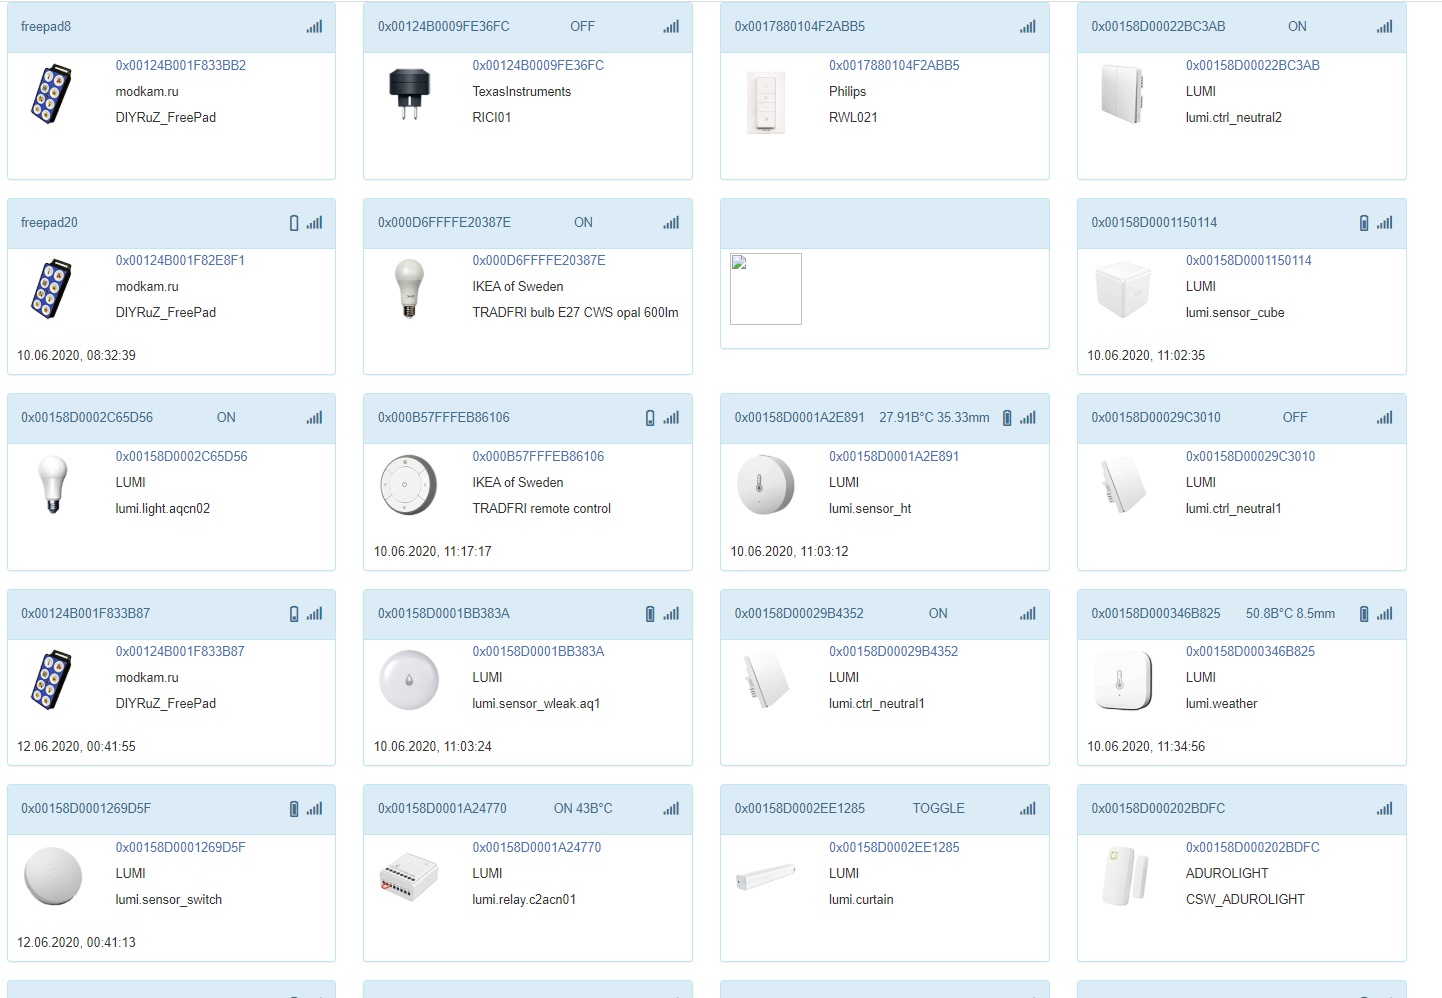
Example dashboard using Bootstrap3:
 [download] (https://raw.githubusercontent.com/slsys/Gateway/master/dashboard/bootstrap3/ui.html)

 SLS Smart Home